![trace-logo-full-colour-rgb-1878px@72ppi.png]](https://trace.weareisla.co.uk/hs-fs/hubfs/trace-logo-full-colour-rgb-1878px@72ppi.png?height=50&name=trace-logo-full-colour-rgb-1878px@72ppi.png)
While industry benchmarks can help us understand how an event compares with others, they don't necessarily tell us whether its emissions are consistent with what is needed to address climate change. They simply tell us how an event performs relative to a wider dataset.
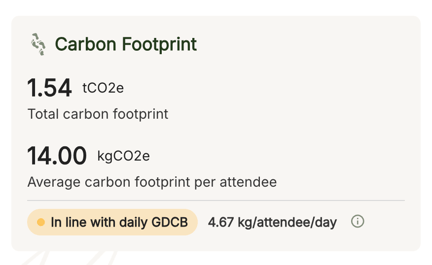
In the absence of established global benchmarks for event emissions, TRACE uses the concept of a Global Daily Carbon Budget (GDCB) to provide an additional reference point.
What is the Global Daily Carbon Budget?
The Intergovernmental Panel on Climate Change (IPCC) establishes global carbon budgets that estimate how much CO₂ humanity can still emit while limiting warming to specific temperature thresholds, including 1.5°C.
Researchers have sought to translate these global climate goals into individual lifestyle emissions targets, helping us understand what they mean in terms of our daily activities.
In its 2025 report, A Climate for Sufficiency: 1.5-Degree Lifestyles, the Hot or Cool Institute identified a 2030 lifestyle emissions target of approximately 1.7 tonnes CO₂e per person per year for a pathway aligned with limiting global warming to 1.5°C.
This equates to approximately 4.7 kgCO₂e per person per day, which TRACE rounds to 5 kgCO₂e as an indicative reference point.
This is not a universal daily allowance prescribed by the IPCC. It is a simplified reference derived from independent research.
How TRACE uses it
TRACE calculates the emissions captured for an event, divided by the number of attendees and live event days. This produces an event carbon-intensity figure: kgCO₂e per attendee, per day.
The lower this figure, the less of an attendee’s wider emissions footprint the event represents. It can help teams build greater consistency into event design and identify where reductions are most needed.
This figure is not a judgement on whether an attendee’s full lifestyle footprint is climate-aligned. The underlying lifestyle research covers emissions from all areas of life, including home energy, food, everyday transport, purchases and leisure.
TRACE measures the activity captured for the event. If not all relevant event activity has been measured in TRACE, the intensity figure will understate the event’s actual footprint.
Use the global daily carbon budget as one reference point for direction of travel, and use an event’s own historic performance to understand whether its emissions are reducing over time.
Sources: IPCC, Global Warming of 1.5°C; IGES, 1.5-Degree Lifestyles; Hot or Cool Institute, 1.5-Degree Lifestyles.